Comparison of two cutting-edge dynamic topic models in consumer complaints classification

Summarize essential information from article metadata with text mining methods
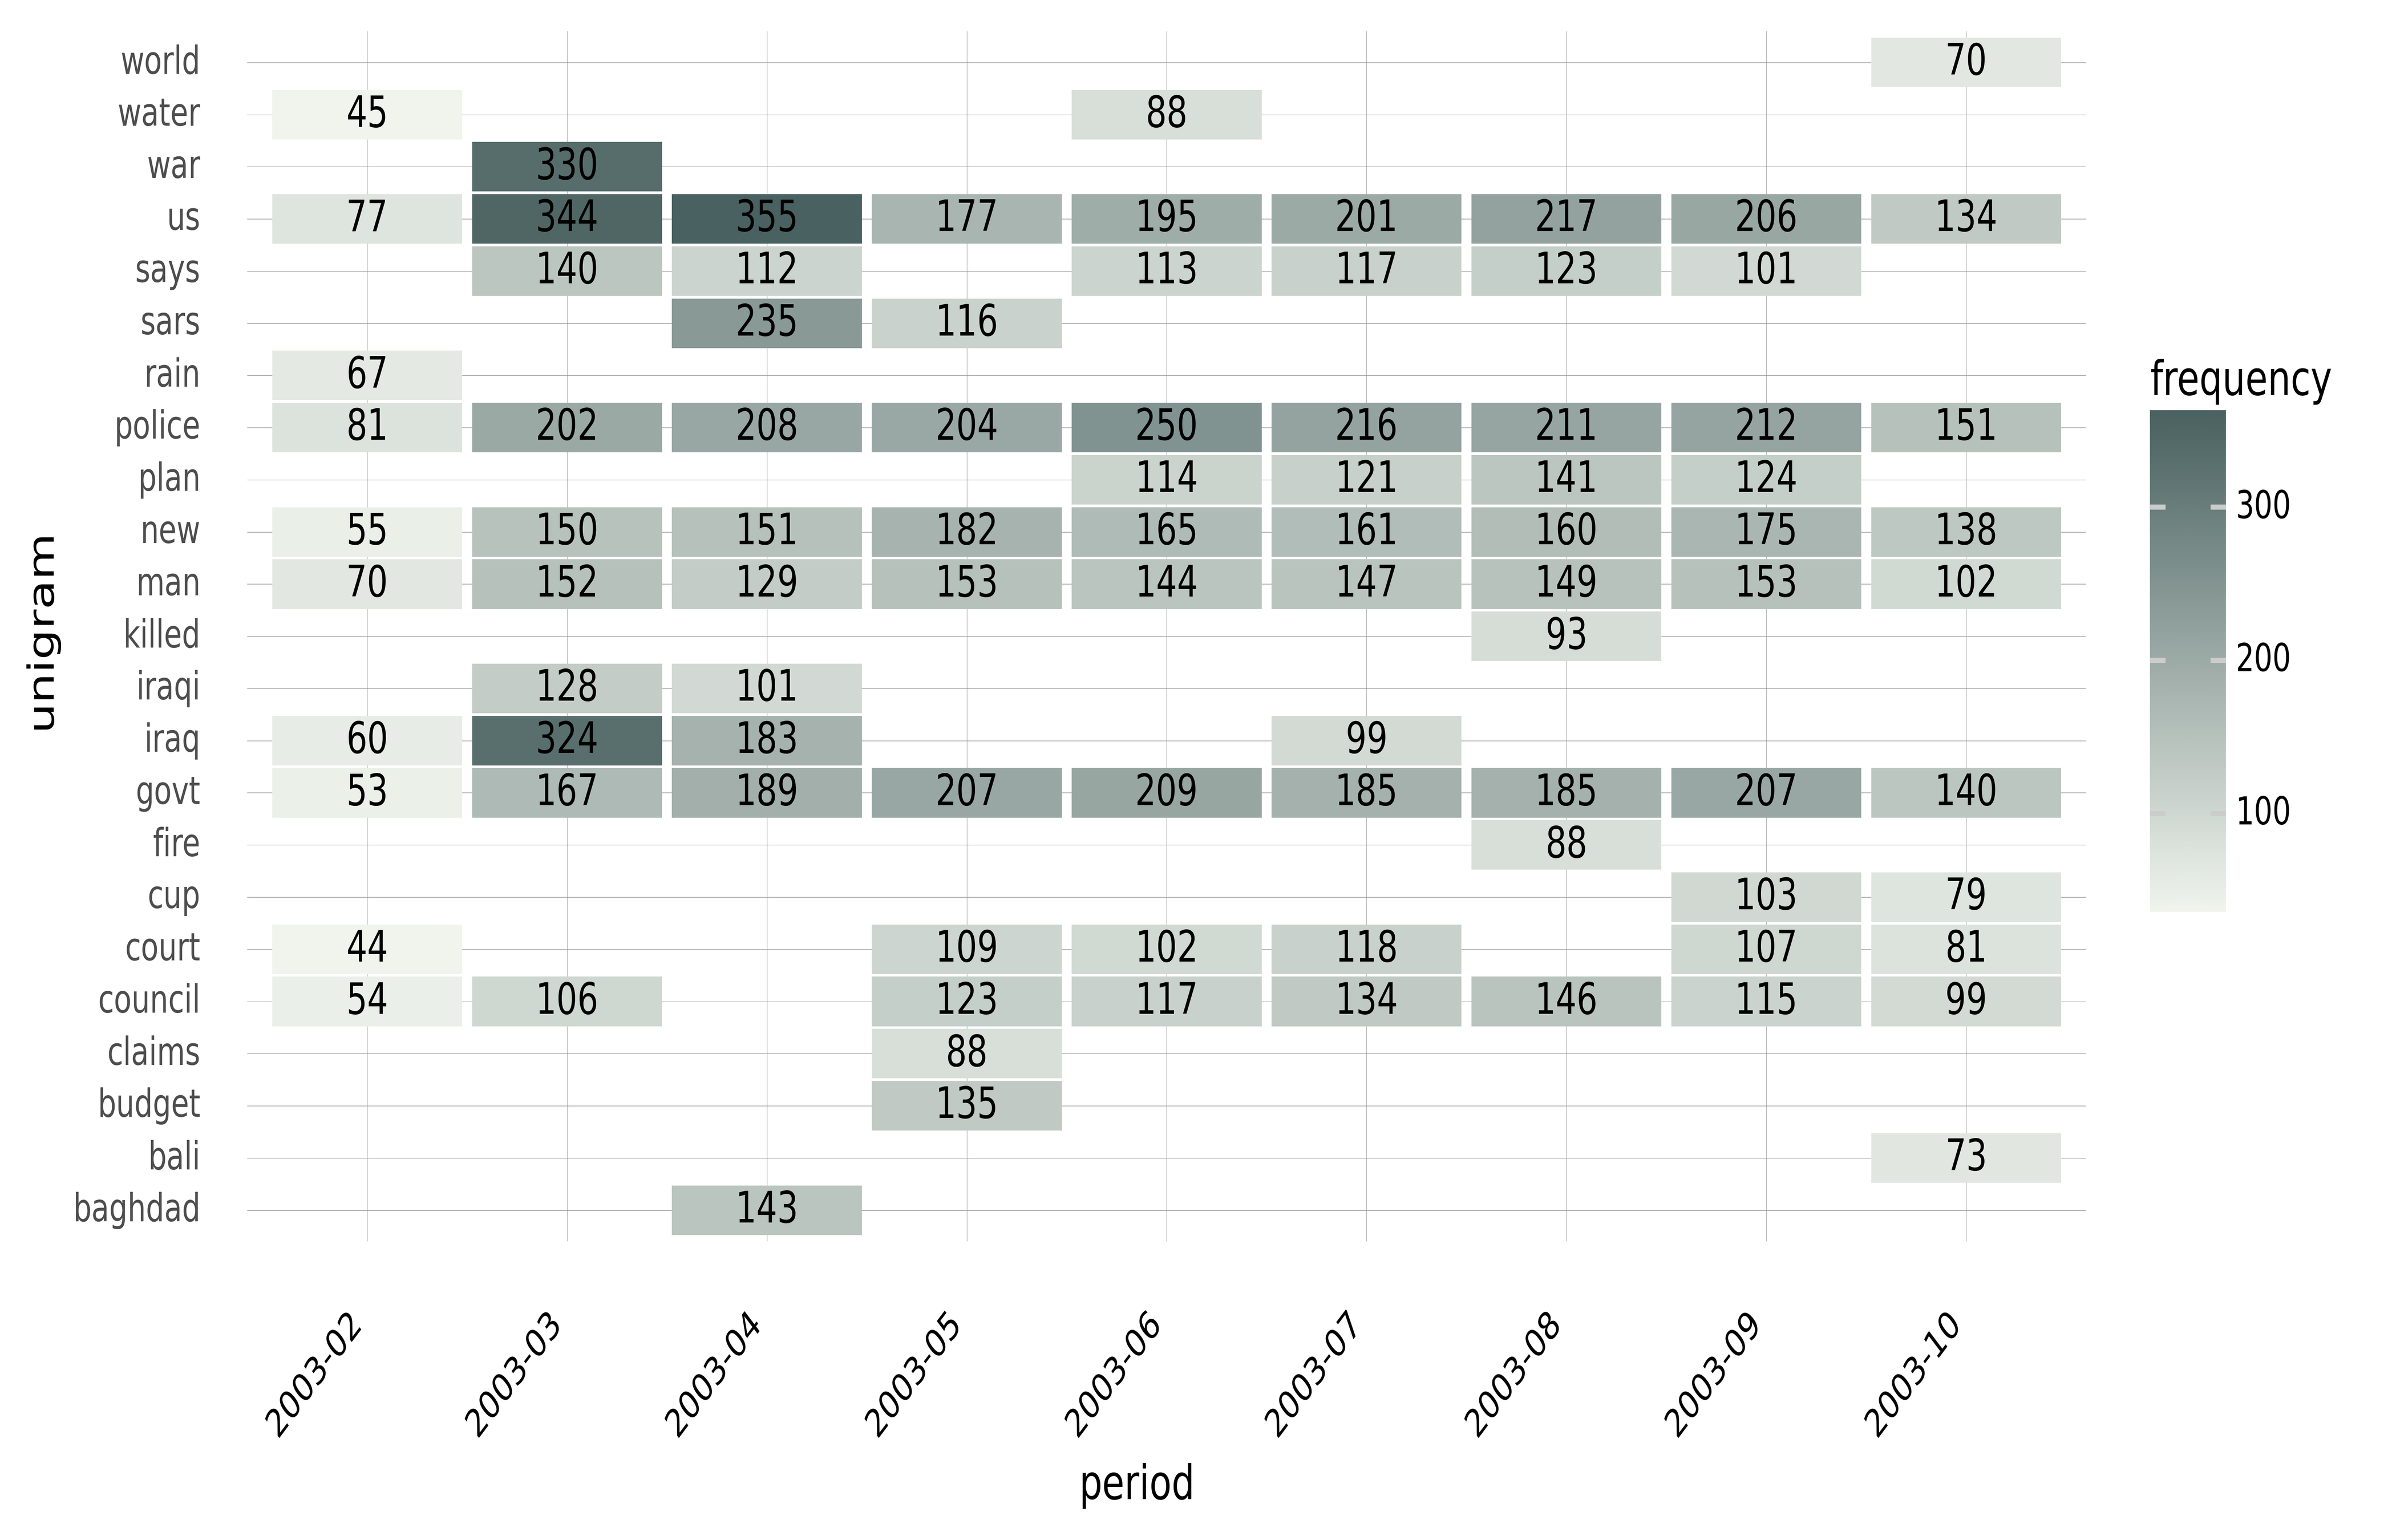
Arabica now offers bigram and trigram word cloud, heatmap, and line chart
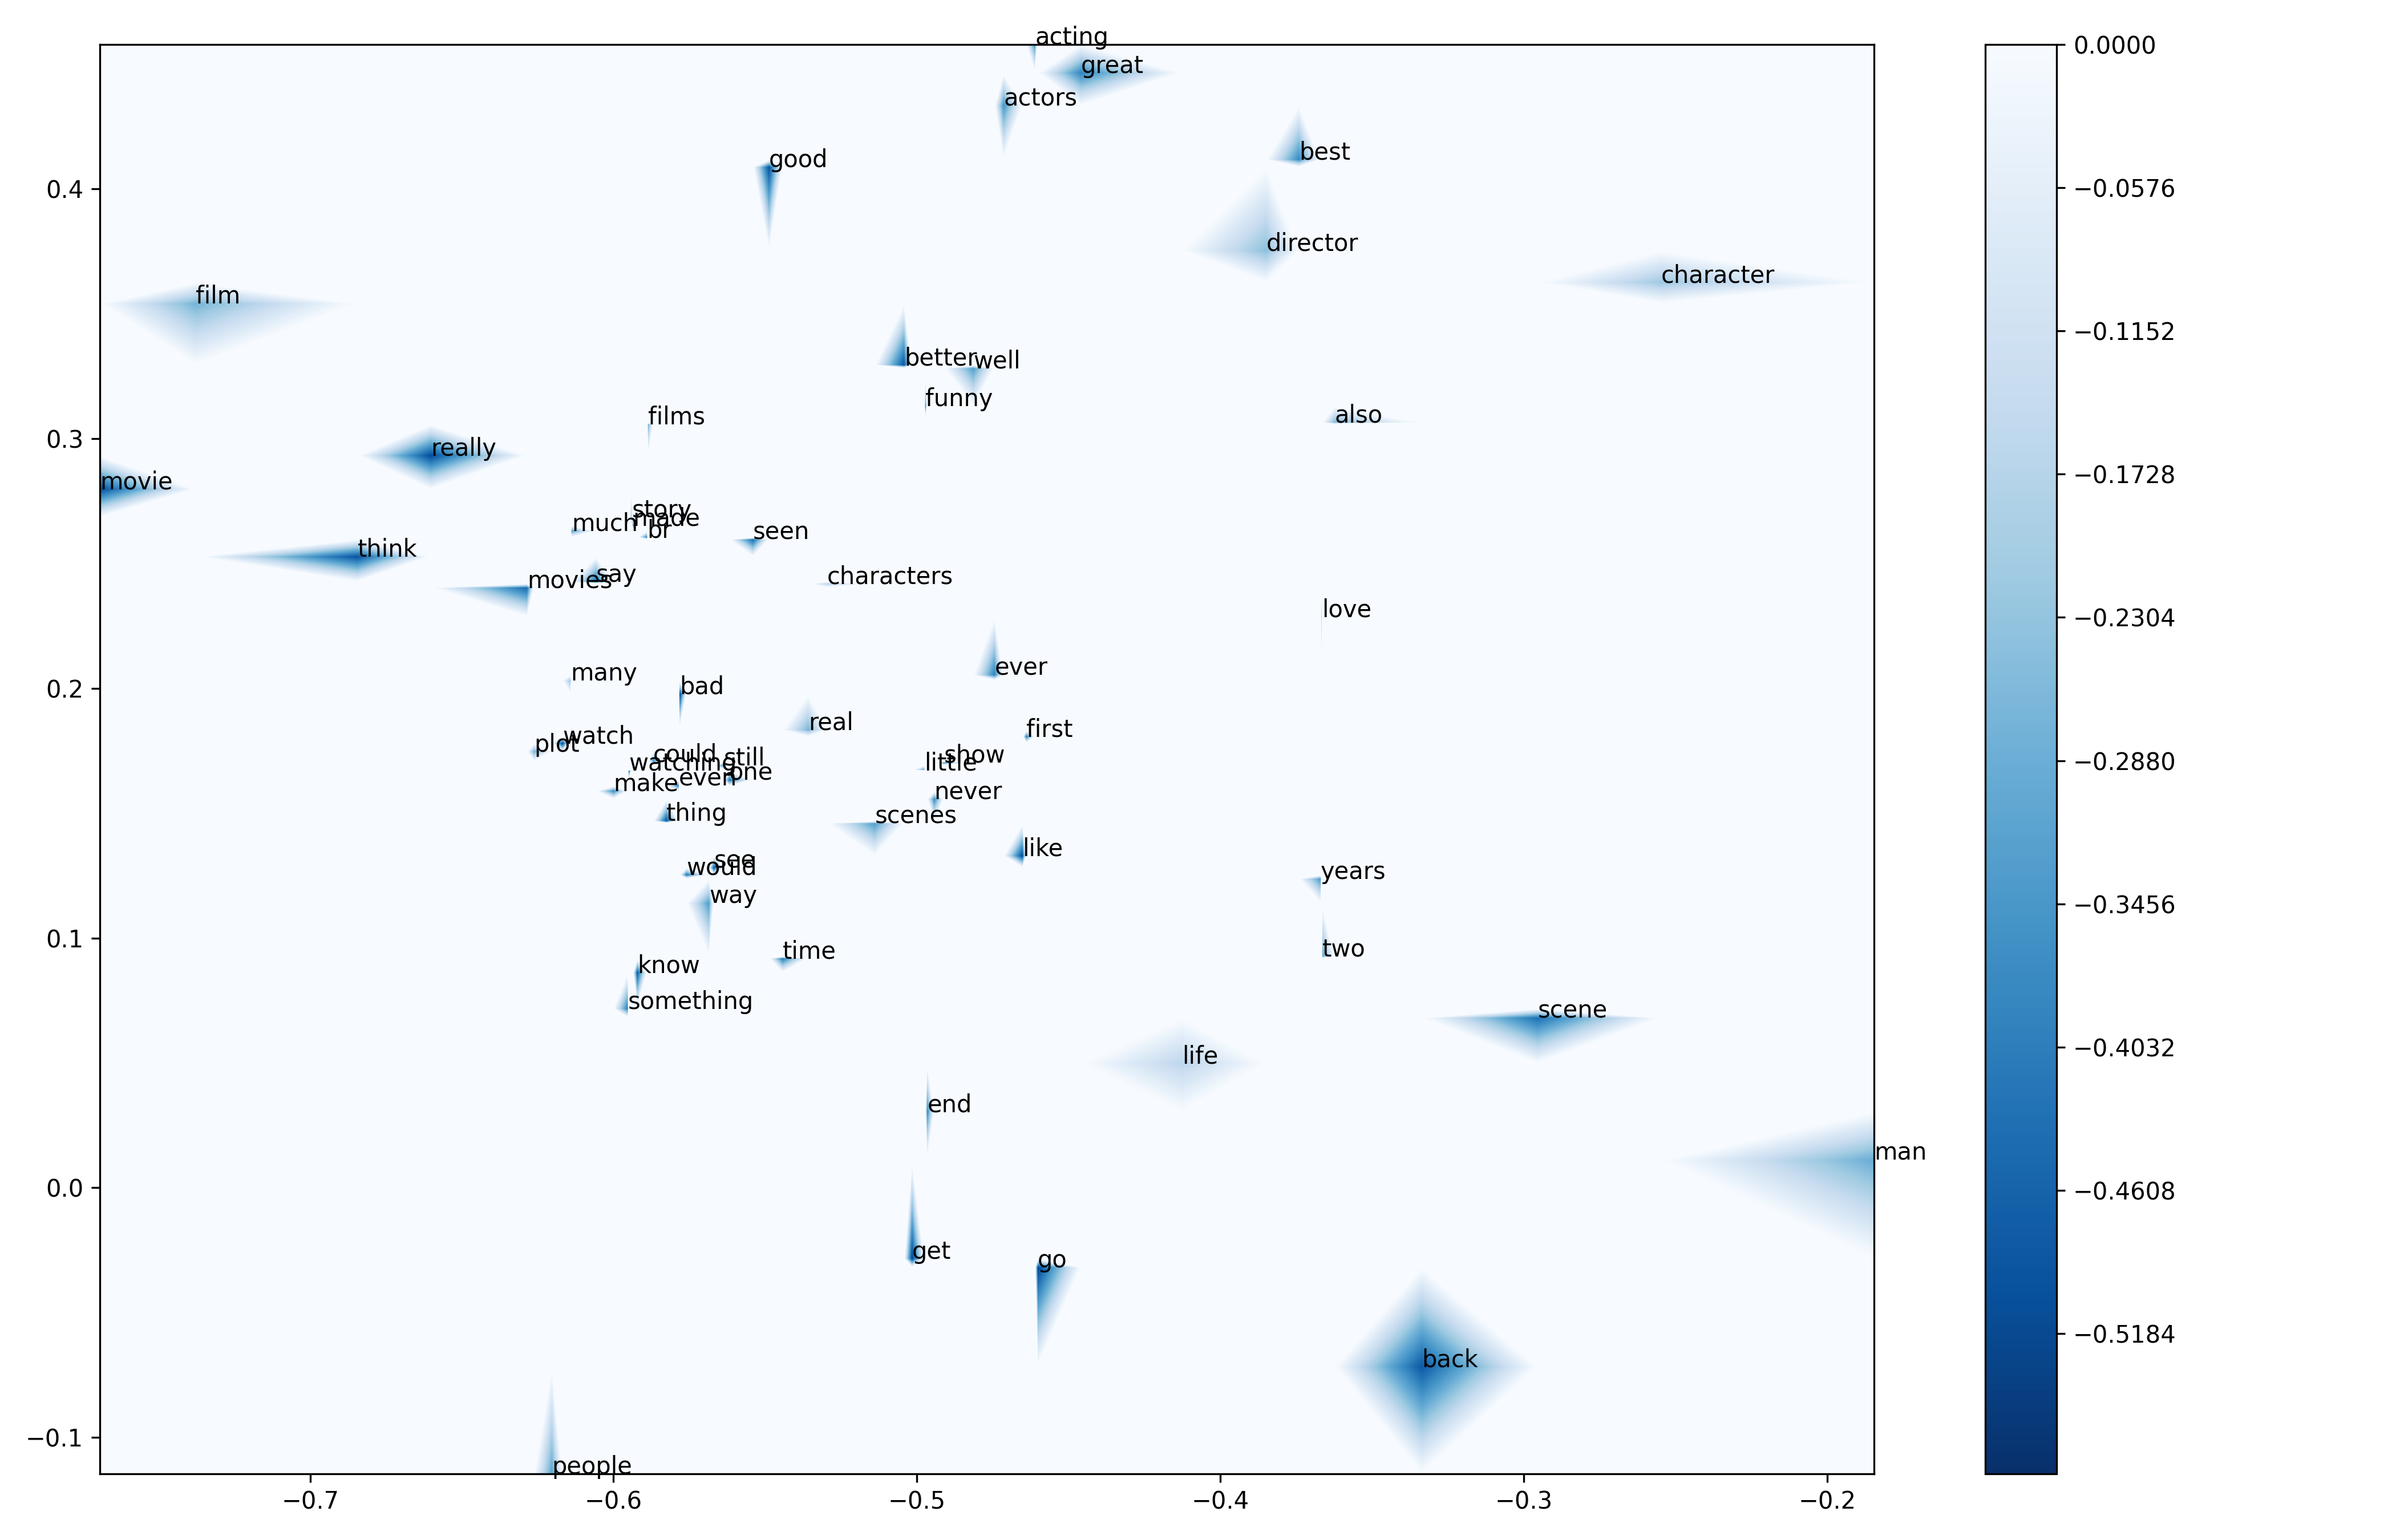
Contour plots are simple and very useful graphics for word embedding visualization.

Arabica 1.0 improves time series text data analysis with an extended set of features
Discover how to visualize text networks in the circular, radial, and matrix plots
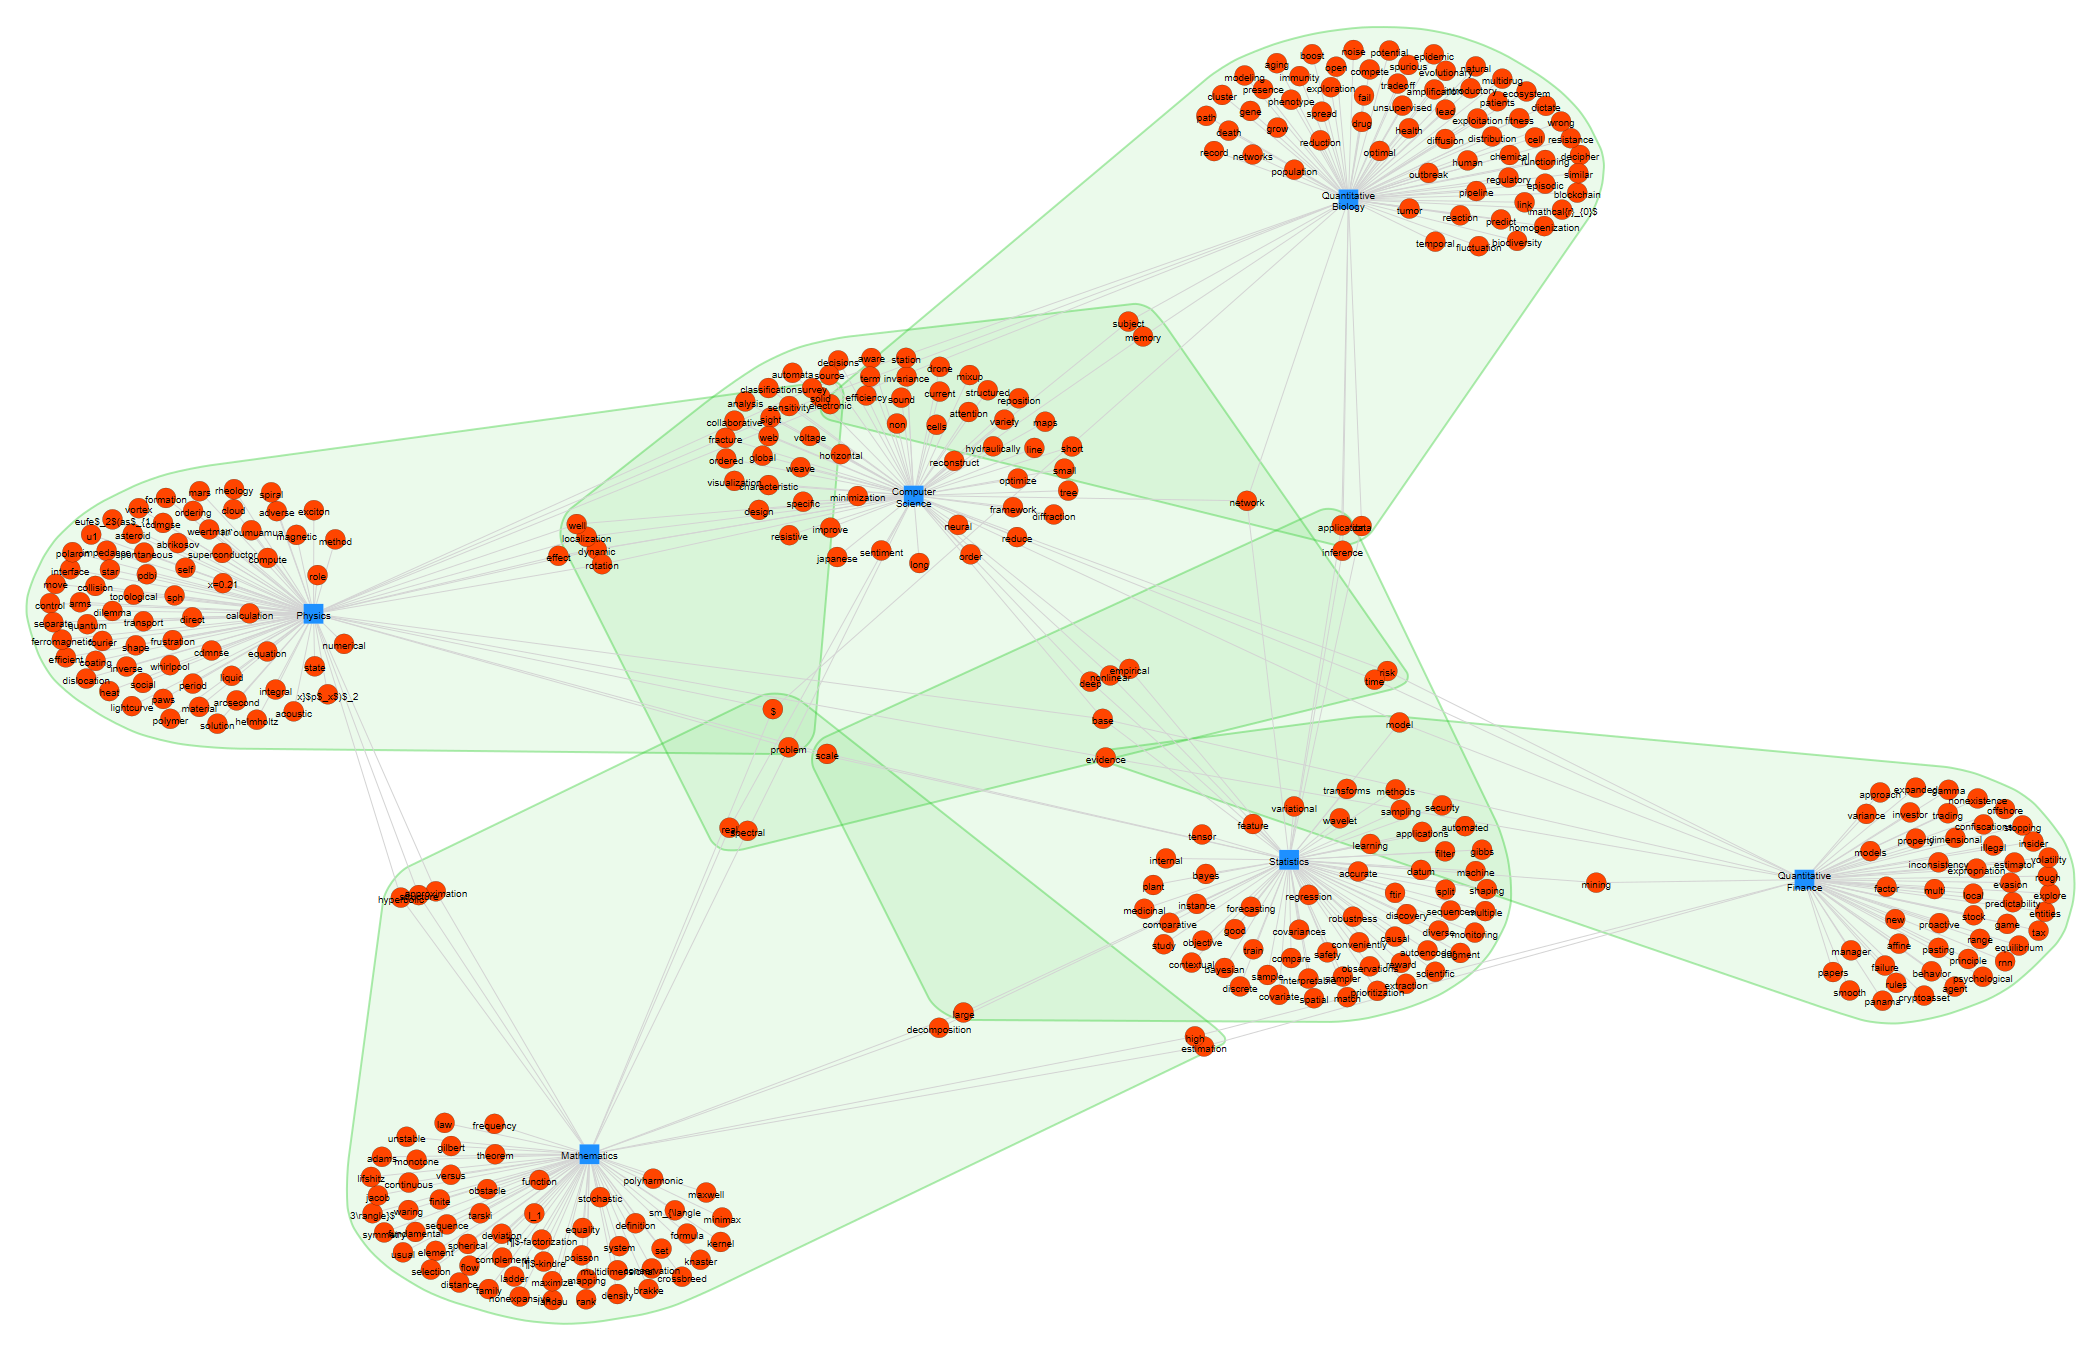
Concise, methodical guide, from use case definition to network estimation
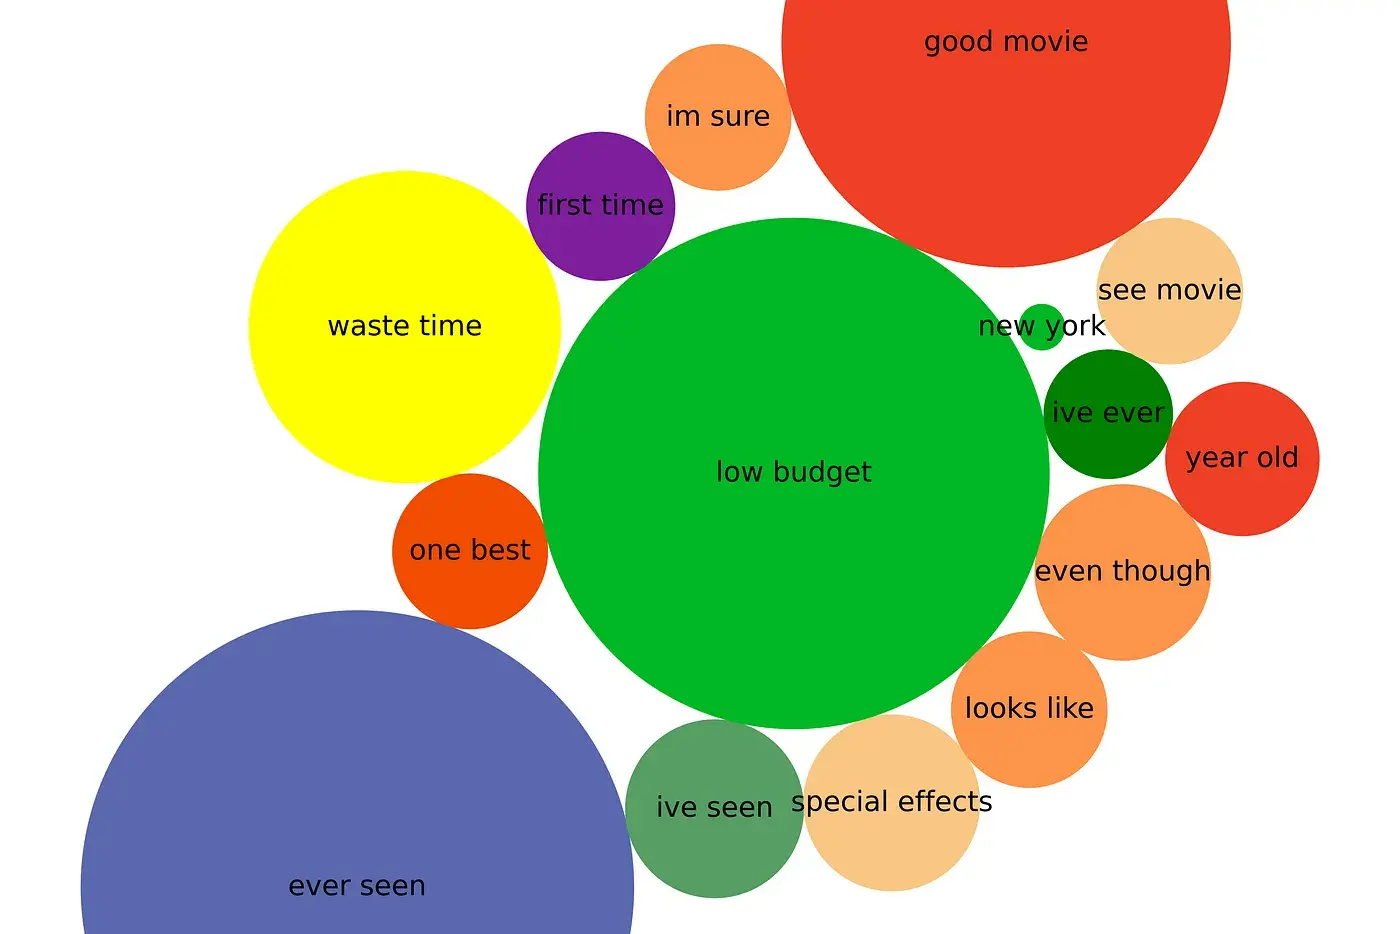
Explore n-gram word cloud, chord diagram, and a bubble chart, and their implementation in Python

Text network analysis belongs to the broader skill set of most text data-oriented analysts.